 BGS Data Catalogue
Bed rock
Type of resources
Topics
Keywords
Contact for the resource
Provided by
Years
Formats
Representation types
Update frequencies
Scale
-
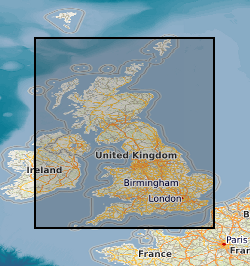
A series of tiled models of superficial thickness covering the UK. The models are derived by direct modelling (natural neighbour interpolation) of BGS Borehole records and BGS Digmap. For the purposes of modelling, superficial deposits include sediments deposited during the Quaternary, subsequent Holocene rivers and coastal systems and also modern anthropogenic material. i.e. deposits that are less than 2.6 million years old. Grids are overprinted with a minimum value so that areas where no bore data is present, but drift is known to occur are given a minimum 1.5m thickness. The superficial thickness models have been created as baseline datasets for the BGS Geohazard programme. They represent the first attempt by BGS to create nationwide models of such data and the models provide only a simple, mathematical interpretation of reality. The complexity of Superficial deposits in Great Britain is such that it is only possible to model indicative values of thickness and elevation. The models should never be used as a substitute for thorough site investigation.
-
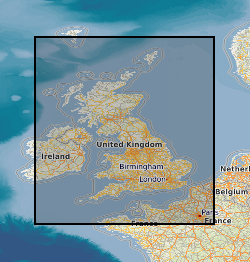
The Bedrock summary lithologies dataset is digital geological map across the bulk of the UK Continental Shelf (UKCS), for areas up to a water depth of 200m, which groups the bedrock lithologies (rock types) into classes based on similar engineering geology characteristics. The map is derived from the 1:250,000 scale digital bedrock map of the UKCS, called DiGRock250k, which is available separately from the BGS. The map was produced in 2014 in collaboration with, and co-funded by, The Crown Estate as part of a wider commissioned project to assess seabed geological constraints on engineering infrastructure across the UKCS. The divisions on the map combine the bedrock formations into 8 classes (with several subdivisions) of similar strength and lithological variability, each with a ‘Category’ title that summarises their main lithological character: Class1 – Igneous; Class 2 - Tertiary Sandstone and Limestone; Class 2.5 - Tertiary Sandstone and Limestone Interbedded; Class 3 - Tertiary Mudstone; Class 4 - Mesozoic Sandstone and Limestone; Class 4.5 - Mesozoic Sandstone and Limestone Interbedded; Class 5 - Mesozoic Mudstone; Class 6 – Chalk; Class 7 – Metamorphic; Class 8 - Palaeozoic Sedimentary. The data are held by the BGS as an ESRI ArcGIS Shapefile.
-
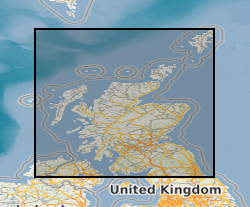
The Bedrock Aquifer Productivity Scotland dataset forms part of the BGS Hydrogeological Maps of Scotland data product. This product is comprised of three datasets: Bedrock Aquifer Productivity Scotland; Superficial Aquifer Productivity Scotland; and Groundwater Vulnerability Scotland. Aquifer productivity is a measure of the potential of aquifers to sustain a borehole water supply. The Bedrock Aquifer Productivity Scotland dataset version 2 (2015) indicates the location and productivity of bedrock aquifers across Scotland, and their groundwater flow characteristics. Developed as a tool to support groundwater resource management, the dataset provides a guide to aquifer characteristics at a regional scale, and may be useful to anyone interested in learning more about, assessing or managing groundwater resources across Scotland. The dataset is delivered at 1: 100 000 scale; the resolution of the dataset being 50 m and the smallest detectable feature 100 m.
-

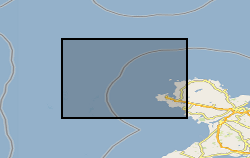
The Seabed Geology 10k: Bristol Channel is a digital geological map portraying the distribution of the different geological substrate units (either of bedrock or unlithified deposits) present on the seabed at a 1:10 000 scale. Additionally, to the Seabed Substrate layer, this dataset also includes i) a Geomorphology layer, revealing the presence and distribution of seabed morphological and geomorphological features and ii) a Structural Geology layer, that delineates the principal structural features observed at rockhead. The bedrock geology is divided into seven stratigraphical units: Pembroke Limestone Group (PEMB); Mercia Mudstone Group (MMG); Penarth Group (PNG); the Lias Groups' St Mary’s Well Bay (STM), Lavernock Shales (LVN) and the Porthkerry (PO) members; and the Inferior Oolite Group (INO). The Lexicon code of the stratigraphical units is provided in parentheses, as defined in the ‘BGS Lexicon of Named Rock Units’. The superficial deposits mapped are comprised of only marine sediments that were classified based on their grain size. However, Folk classification was not used to define the sediment classes. The sediments are divided into Gravel (V); Sand and Gravel (XSG); Sand (S); Sand and Mud (XSM); Mud (M); and Gravel, Sand and Mud (XVSM). The RCS code of the stratigraphical units is provided in parentheses, as defined in the ‘BGS Rock Classification Scheme’.
-

This is a 1:10,000 scale Bedrock geological map for some 800 km2 of the seabed across Weymouth Bay in Dorset. It joins seamlessly to the onshore BGS 1:10,000 scale Digital Geological Mapping (DiGMapGB-10) and therefore shows the coastal geology in detail. It comprises bedrock polygons, faults and limestone bed lines. The map was produced in 2015-16 by digitising against a seamless on- to offshore-shore elevation surface generated from high (1 m bin) resolution bathymetry and coastal Lidar data, collected as part of the Dorset Integrated Seabed Survey (DORIS) project and the Regional Coastal Monitoring Programme of England, made available by the Channel Coastal Observatory under the Open Government Licence. The map can be veiwed using the map viewer at www.bgs.ac.uk/research/marine/doris.html. This map has been produced under the auspices of the Marine Environmental Mapping Programme (MAREMAP), in collaboration between the BGS and the University of Southampton. The map itself should be referred to as: Westhead, R K, Sanderson, D J, Dix, J K. 2016. Bedrock map for the offshore Weymouth Bay area, with seamless coastal joint to BGS onshore (DiGMapGB-10) mapping. Bedrock Geology. 1:10 000 (Marine Environmental Mapping Programme, MAREMAP)
-

The BGS Hydrogeological Maps of Scotland data product is comprised of three datasets: Bedrock Aquifer Productivity (Scotland); Superficial Aquifer Productivity (Scotland); and Groundwater Vulnerability (Scotland). Aquifer productivity is a measure of the potential of aquifers to sustain a borehole water supply. The Aquifer Productivity (Scotland) datasets indicate the location and productivity of bedrock and superficial aquifers across Scotland, and their groundwater flow characteristics. The Groundwater Vulnerability (Scotland) dataset shows the relative vulnerability of groundwater to contamination across Scotland. The BGS Hydrogeological Maps of Scotland data product is developed as a tool to support groundwater resource management. It may be useful to anyone interested in learning more about, assessing or managing groundwater resources across Scotland. The datasets within the product are delivered at 1: 100 000 scale.
-
The BGS Seabed Geology 10k: Anglesey digital map portrays the distribution of the different types of bedrock and sediments that are interpreted to represent the dominant geology within to the top 1-2 metres of the seabed to the north-west of Anglesey, at a scale of 1:10 000. It also includes the distribution of the main seabed morphological and geomorphological features (e.g. drumlins, sandwaves) and the principal structural features observed at rockhead (fractures). This digital map is the result of the interpretation of two high-resolution, multibeam echo-sounder (MBES) bathymetry datasets: (i) the Off Skerries HI1420 survey, collected by Net Survey in 2013 as part of the Civil Hydrography Programme (CHP) surveys managed by the Maritime and Coastguard Agency (MCA) for the UK Hydrographic Office; and (ii) the North St George’s Channel candidate Marine Conservation Zone (rMCZ) survey, collected jointly by JNCC and Cefas in 2012 for the Department for Environment, Food and Rural Affairs (Defra). MBES backscatter, physical samples (e.g. grabs, cores, and boreholes), academic papers and previous BGS geological interpretations at broader scales (250k and 50k scales) were used to further inform this geological interpretation. The bedrock is divided into three units: (i) Neoproterozoic to Palaeozoic age metamudstones and metasandstones of the Monian Supergroup; (ii) undifferentiated Lower Palaeozoic age rocks (mudstone, volcaniclastics, siltstone, slate); and (iii) limestone and sandstone of the Carboniferous Limestone Supergroup. The superficial deposits are composed of various types of glacial sediments (e.g. glacial till and morainic deposits) that were deposited underneath and around the margins of the last British-Irish Ice Sheet in the area, and also more recently deposited marine sediments.
-

The UK Geoenergy Observatories (UKGEOS) Glasgow 3D coal mine model outputs, created by the British Geological Survey, provide a semi-regional overview of the depth and extent of surveyed and probable coal mine workings, plus stone and coal roads surveyed within the mines. The model allows users to visualise the surveyed and probable coal mine workings to be found beneath this part of Glasgow, applicable at a scale of around 1: 25,000 to 1: 10,000. The data is supplied as grids, triangulated surfaces over a 5 by 4.15 km area, with the depth range to around 300 m below Ordnance Datum. The mine extents are ‘cut out’ of the UKGEOS Glasgow post-drill bedrock model. This model describes both surveyed (recorded on mine abandonment plan) and probable coal mine workings. An area of probable workings has been updated to account for the results of drilling borehole GGC01. Further details and model limitations can be found in the accompanying metadata report http://nora.nerc.ac.uk/id/eprint/531157/
-

The UK Geoenergy Observatories (UKGEOS) Glasgow bedrock model outputs, created by the British Geological Survey, provide a semi-regional overview of the depth and extent of bedrock lithostratigraphic units, coals and faults. The model allows users to visualise the likely subsurface sequence to be found beneath this part of Glasgow, applicable at a scale of around 1: 25,000 to 1: 10,000. The data is supplied as grids, triangulated surfaces and shapefiles over a 5 by 4.15 km area, with the depth range to around 350 m below Ordnance Datum. This model describes an interpretation of the bedrock geology after the UKGEOS Glasgow boreholes had been drilled, the results of the nine UKGEOS boreholes that penetrated bedrock have been incorporated. Further details and model limitations can be found in the accompanying metadata report http://nora.nerc.ac.uk/id/eprint/531157/
-
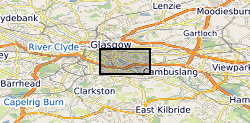
The UK Geoenergy Observatories (UKGEOS) Glasgow 3D coal mine model outputs, created by the British Geological Survey, provide a semi-regional overview of the depth and extent of surveyed and probable coal mine workings, plus stone and coal roads surveyed within the mines. The model allows users to visualise the surveyed and probable coal mine workings to be found beneath this part of Glasgow, applicable at a scale of around 1: 25,000 to 1: 10,000. The data is supplied as grids, triangulated surfaces over a 5 by 4.15 km area, with the depth range to around 300 m below Ordnance Datum. The mine extents are ‘cut out’ of the UKGEOS Glasgow pre-drill bedrock model. This model describes both surveyed (recorded on mine abandonment plan) and probable coal mine workings before the UKGEOS Glasgow boreholes have been drilled, and was used to inform the expected sequence on drilling. Further details and model limitations can be found in the accompanying metadata report http://nora.nerc.ac.uk/id/eprint/522737